mydocs
ppplot
P-Pプロット
概要
二つの確率分布(またはデータの分布)が与えられた時、それぞれの対応する累積確率をプロットしたもの
使い方
xi = [320, 240, 402, 325, 440, 286, 362, 281, 560, 212, 198, 209, 374]
Num4NormalityLib.ppplot("LDH", xi)
出力サンプル
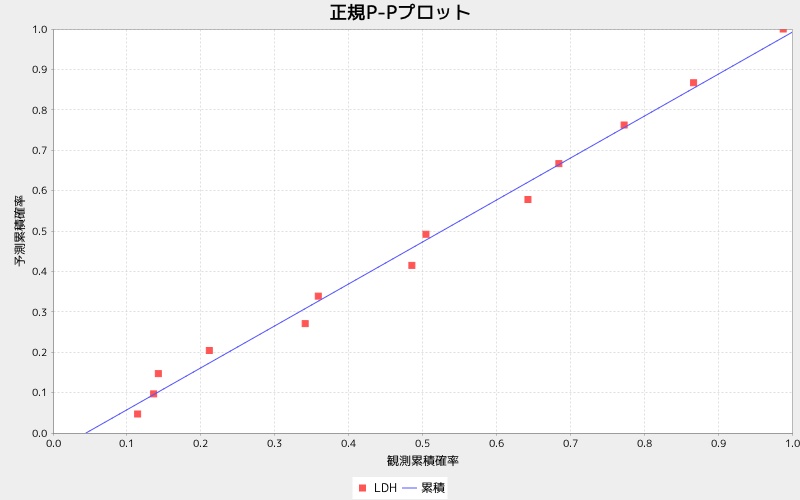
P-Pプロット
二つの確率分布(またはデータの分布)が与えられた時、それぞれの対応する累積確率をプロットしたもの
xi = [320, 240, 402, 325, 440, 286, 362, 281, 560, 212, 198, 209, 374]
Num4NormalityLib.ppplot("LDH", xi)