mydocs
qqplot
Q-Qプロット
概要
データの分位点を理論的な正規分布の文位点を比較する視覚的手法
縦軸:データ値
横軸:データの期待値を標準化した値(正規分布んの理論値)
使い方
xi = [320, 240, 402, 325, 440, 286, 362, 281, 560, 212, 198, 209, 374]
Num4NormalityLib.qqplot("LDH", xi)
出力サンプル
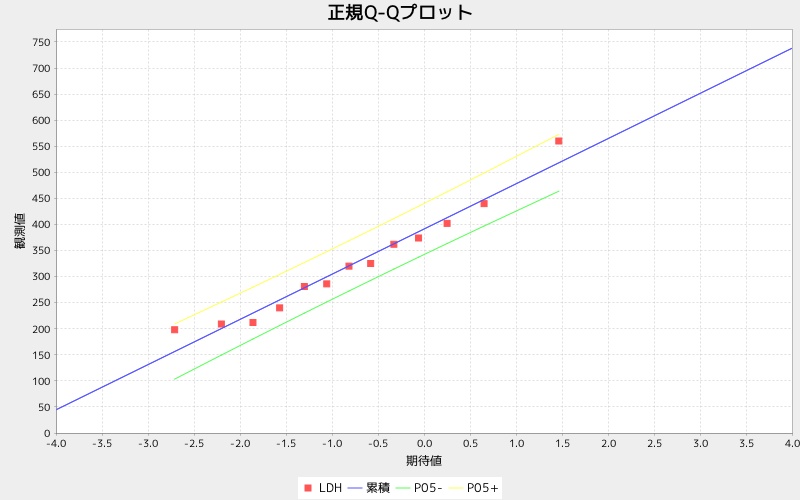
Q-Qプロット
データの分位点を理論的な正規分布の文位点を比較する視覚的手法
縦軸:データ値
横軸:データの期待値を標準化した値(正規分布んの理論値)
xi = [320, 240, 402, 325, 440, 286, 362, 281, 560, 212, 198, 209, 374]
Num4NormalityLib.qqplot("LDH", xi)